Transforming Numbers Into Persuasive Stories
Raw data doesn’t win cases — stories do. Jurors may glance at spreadsheets or expert testimony and tune out, but when those same numbers are turned into compelling visuals, they suddenly make sense. We transform data into graphics, charts, and infographics that highlight key points and connect directly to jurors’ understanding.
Why It Matters?
Clarity over confusion
Complex spreadsheets or expert reports can overwhelm jurors. Visualizing the numbers turns abstract figures into simple, persuasive evidence.

Finding the signal in the noise
Data is often massive and messy. We extract the most important points and display them in ways that highlight trends, outliers, and cause-and-effect relationships.
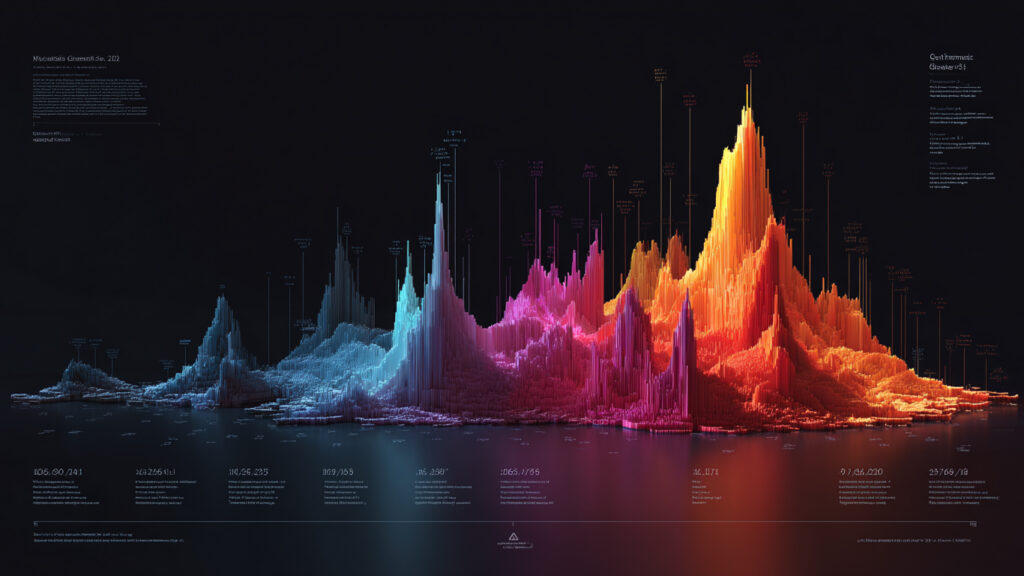
Memory that sticks
Jurors rarely recall raw percentages or ratios. But a well-designed chart or infographic lingers in their minds, carrying your narrative into deliberation.

Credibility in presentation
Professional, polished visuals signal preparation and reliability, giving jurors more confidence in the story you’re telling with the data.

What we offer
Custom Charts & Graphs
Tailored visuals that turn statistics into clear, easy-to-read formats.

Infographics
Engaging designs that combine text, icons, and visuals to highlight the story behind the data.
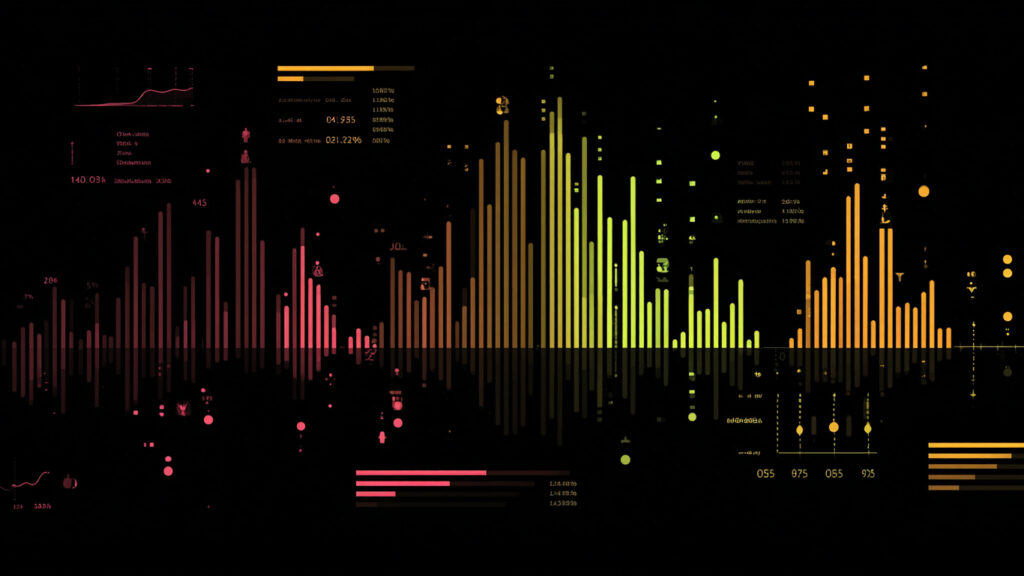
Heatmaps & Visual Trends
Graphics that emphasize patterns, concentration, or change over time in a way that jumps off the page.

Interactive Visuals
Digital exhibits that allow attorneys to highlight, zoom, or isolate key pieces of data during trial.
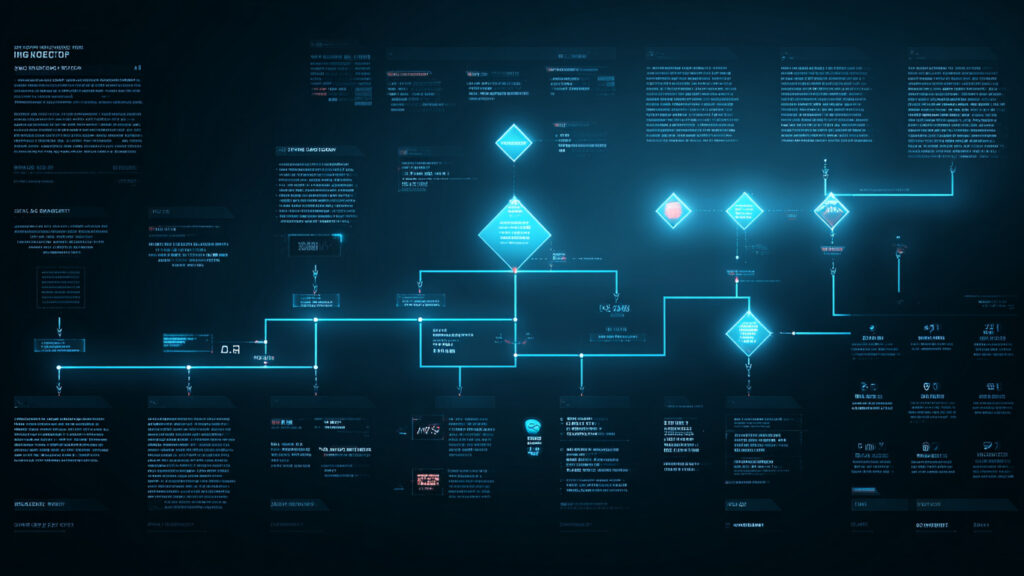
Why Work With Us
Numbers made simple: We turn raw data into stories jurors understand.
Courtroom credibility: Exhibits designed to hold up under scrutiny.
Custom solutions: From static charts to interactive visuals, scaled to your case.
Tell us what you need to show. We’ll make it real.